
Example 2: A large DFN#
This is an example of how to create a simple DFN model using the andfn package.
"""
Note
------
This example demonstrate the andfn package for a large DFN.
"""

import andfn

if __name__ == "__main__":
    """
    IMPORT DFN
    This part initiate the dfn and import the fracture from a file.
    This step will also automatically compute the fracture intersections and add them to the DFN.
    """
    dfn = andfn.DFN("My DFN")
    dfn.import_fractures_from_file("large_dfn.fracs")

    """
    ADD CONSTANT HEAD BOUNDARY CONDITIONS
    This part create a region box and add constant head boundary conditions to the fractures that intersect with the specified faces of the box. It also checks the connectivity of the DFN and sets the solver parameters.

    """
    # Add Region Box boundary
    regbox = andfn.RectangularRegion(
        label="box",
        center=[0, 0, 0],
        x_vec=[1, 0, 0],
        y_vec=[0, 1, 0],
        z_vec=[0, 0, 1],
        xl=1000,
        yl=1000,
        zl=1000,
    )

    regbox.frac_intersections(dfn.fractures, face="left", head=100)
    regbox.frac_intersections(dfn.fractures, face="right", head=200)

    dfn.check_connectivity()

    dfn.set_kwargs(COEF_RATIO=0.001, MAX_ITERATIONS=30, MAX_NCOEF=200, MAX_ERROR=5e-4)

    """
    SOLVE THE DFN

    Everything is set up, now we can solve the DFN. The solver will use the specified parameters to find a solution to the flow problem in the DFN.
    """
    dfn.solve()

    """
    PLOTTING

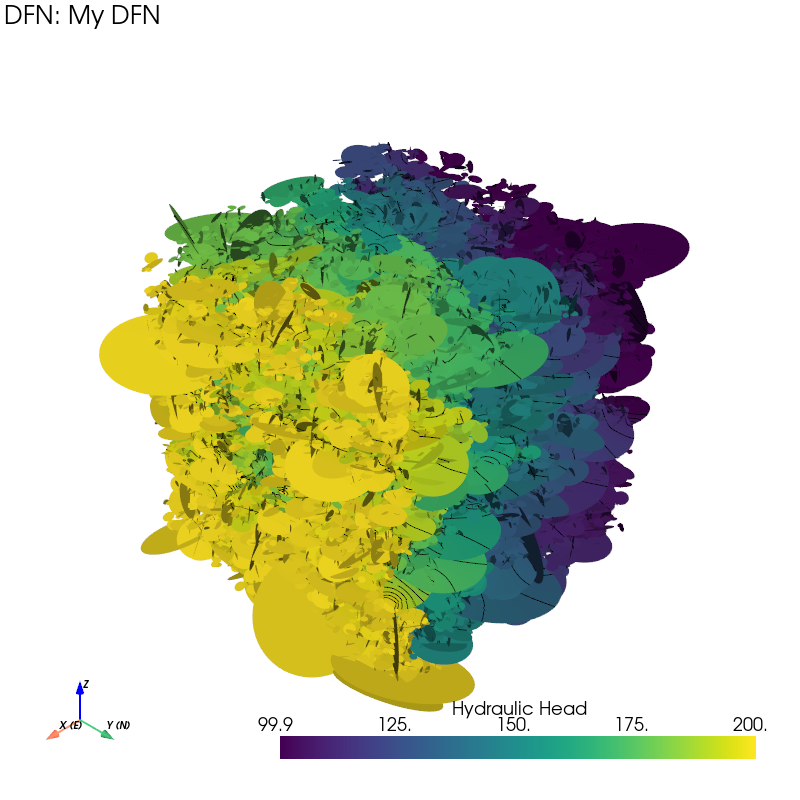
    The hydraulic head distribution in the DFN can be visualized using the plotting functions provided by the andfn library. The plot_fractures_head function will create a 3D plot of the fractures colored by their hydraulic head values. The region box is also plotted to show the boundaries of the simulation domain.
    """
    # This will create a plot window
    p1 = dfn.initiate_plotter(title=True, axis=True)

    # This will plot the fractures colored by their hydraulic head values, with a contour and opacity of 1.
    dfn.plot_fractures_head(p1, 40, 5, opacity=1, contour=True)

    p1.show()  # show the plot

    print("All done!")